e-Reliability Report
Third Taxing District e-Reliability Statistics
IEEE (Institute of Electrical & Electronics Engineers)
1366 Standards
| 2021 | 2020 | 2019 | |
|---|---|---|---|
SAIDI – System Average Interruption Duration Index | |||
| Definition: average interruption duration (in minutes) for customers served by the system. Lower number is better. | |||
| TTD | 2.6 | 60.9 | 35.16 |
| Average for NE Region | 73.41 | 143.34 | 92.41 |
| Average for Similar Size Utilities | 106.86 | 95.46 | 113.03 |
CAIDI – Customer Average Interruption Duration Index | |||
| Definition: Average duration (in minutes) of an interruption experienced by customers. Lower number is better. | |||
| TTD | 138.82 | 94.53 | 80.89 |
| Average for NE Region | 125.39 | 146.95 | 119.7 |
| Average for Similar Size Utilities | 120.25 | 117.55 | 191.75 |
ASAI – Average Service Availability IndexIndex | |||
| Definition: Measure of the availability of the distribution system that serves customers. Higher number is better. | |||
| TTD | 99.9995% | 99.9884% | 99.9933% |
| Average for NE Region | 99.9860% | 99.9798% | 99.9826% |
| Average for Similar Size Utilities | 99.9796% | 99.9820% | 99.9784% |
| Source: Statistics from American Public Power Association Annual Benchmarking Report |
Outage Report
(7/1/2021 to 6/30/2022)
| Date | Cause of Outage | # of Customers Affected | Duration (minutes) | Subtation |
|---|---|---|---|---|
| 7/9/2021 | Storm | 12 | 335 | Rowan Street |
| 9/1/2021 | Storm | 6 | 230 | Rowan Street |
| 1/7/2022 | Manufacturing Defect | 2 | 40 | Rowan Street |
| 1/29/2022 | Vehicle Accident | 15 | 90 | Rowan Street |
| 3/24/2022 | Scheduled | 1 | 45 | Rowan Street |
| 6/16/2022 | Equipment Damage | 124 | 45 | Rowan Street |

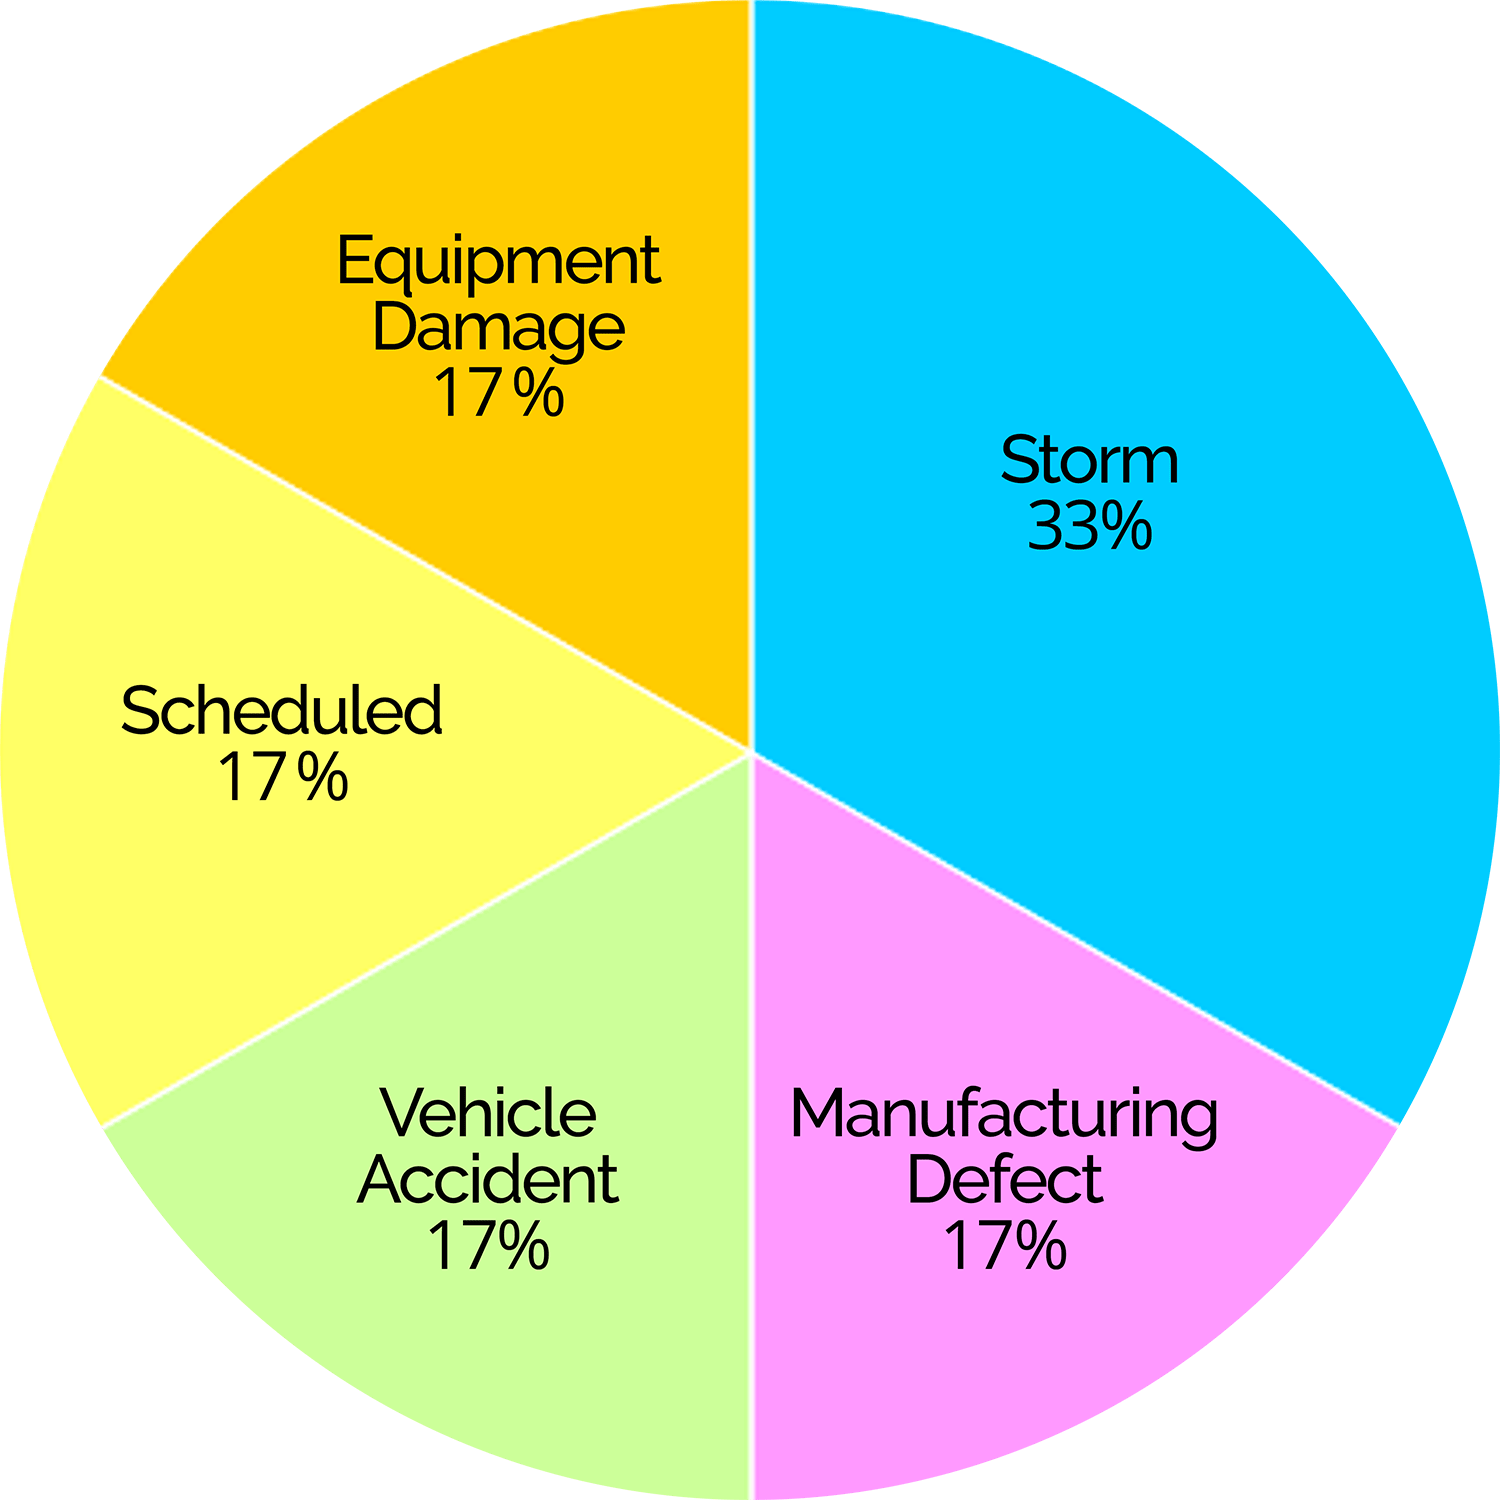
Equipment Damage: 17%
Scheduled: 17%
Vehicle Accident: 17%
Storm: 33%
Manufacturing Defect: 17%

